Charts That See What You See
Our AI automatically detects and draws Orderflow patterns on every chart — Order Blocks, Fair Value Gaps, Liquidity Sweeps, Break of Structure, Asian Range. No manual drawing. No guessing.
Institutional-Grade Pattern Detection
Every chart is generated from live MT5 market data with automatic Orderflow + Delta Footprint pattern detection. These are real charts rendered by our proprietary engine.
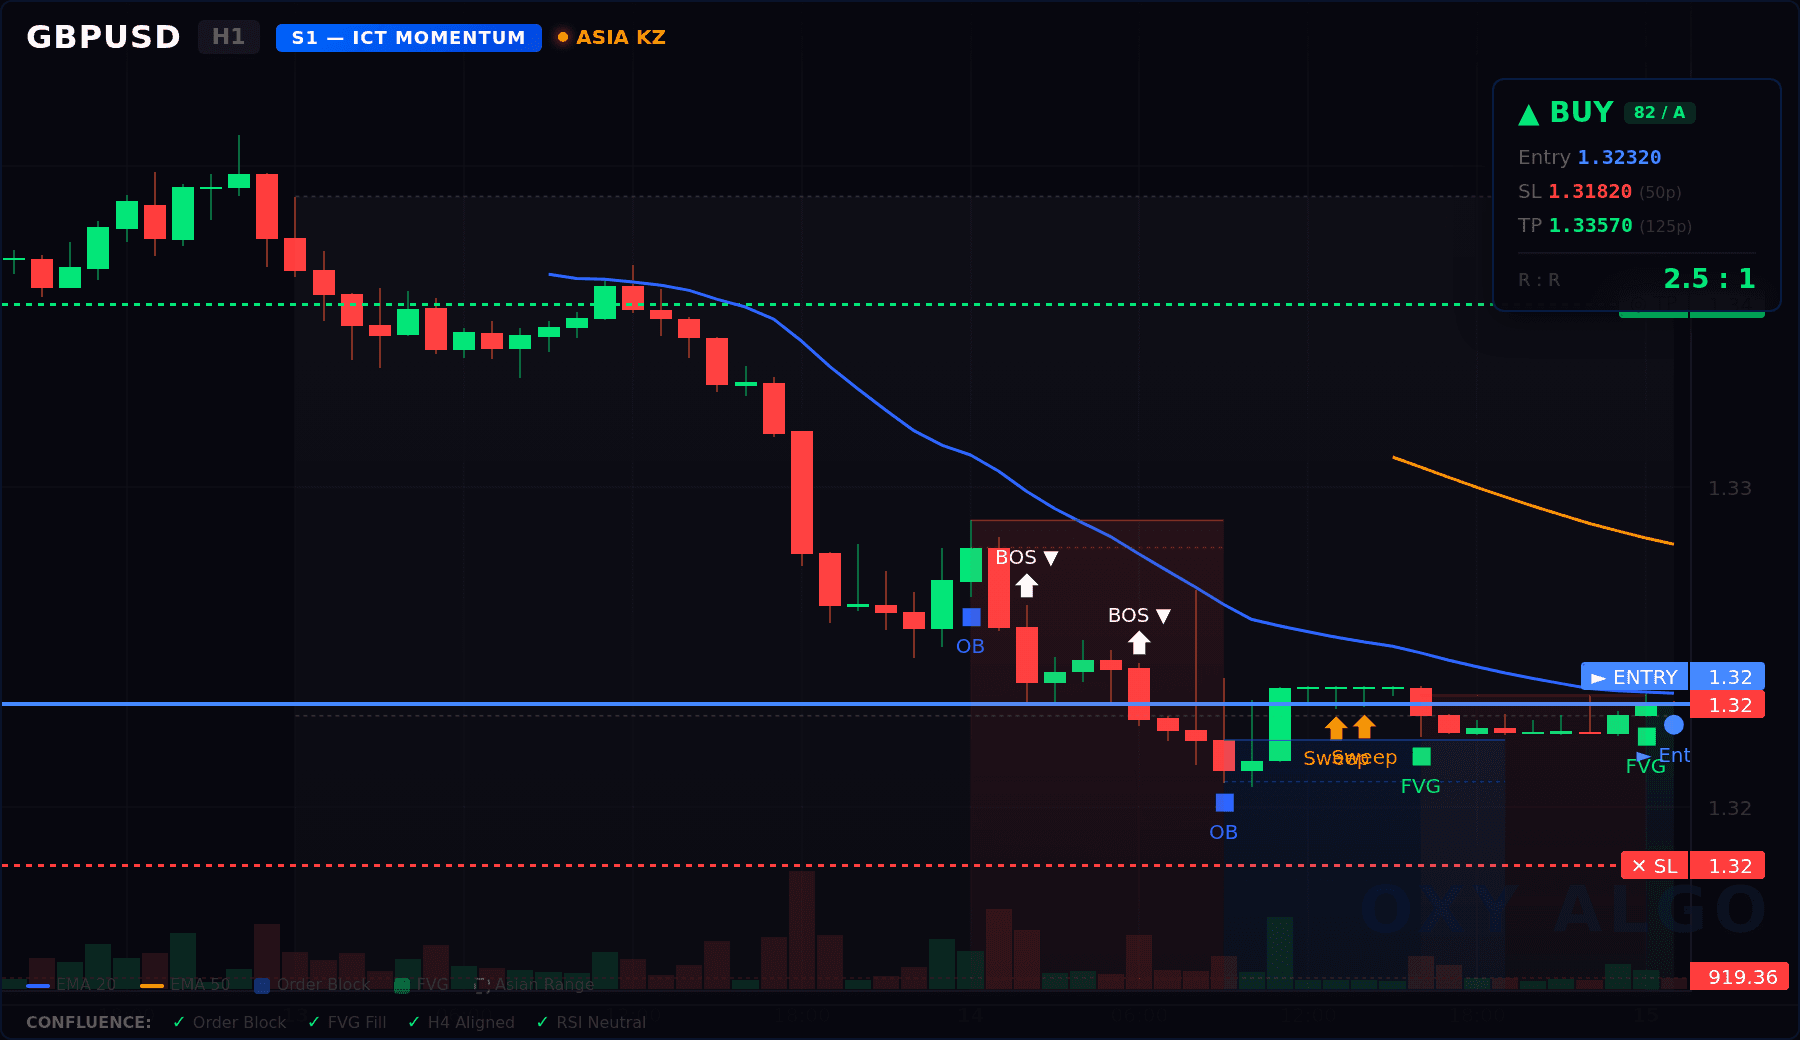
Order Blocks and FVG detected with signal overlay. EMA 20/50 crossover visible.
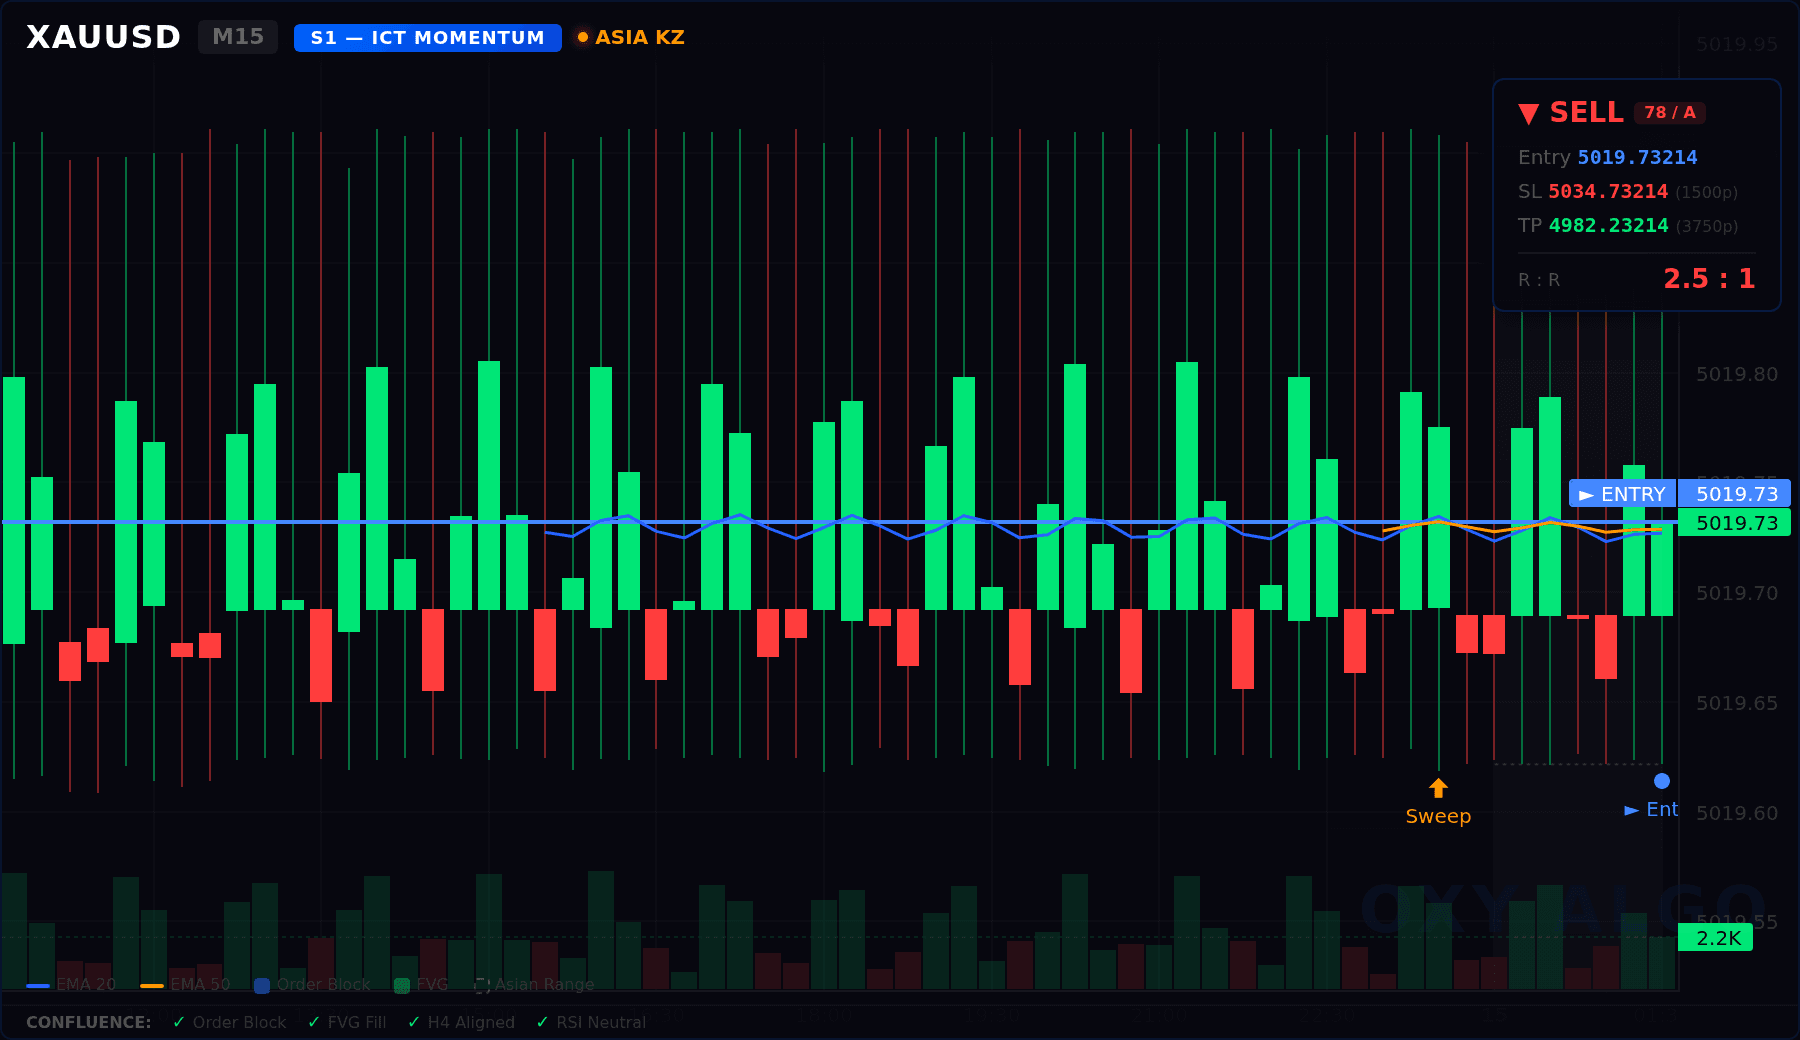
Gold with liquidity sweep markers and break of structure detection.
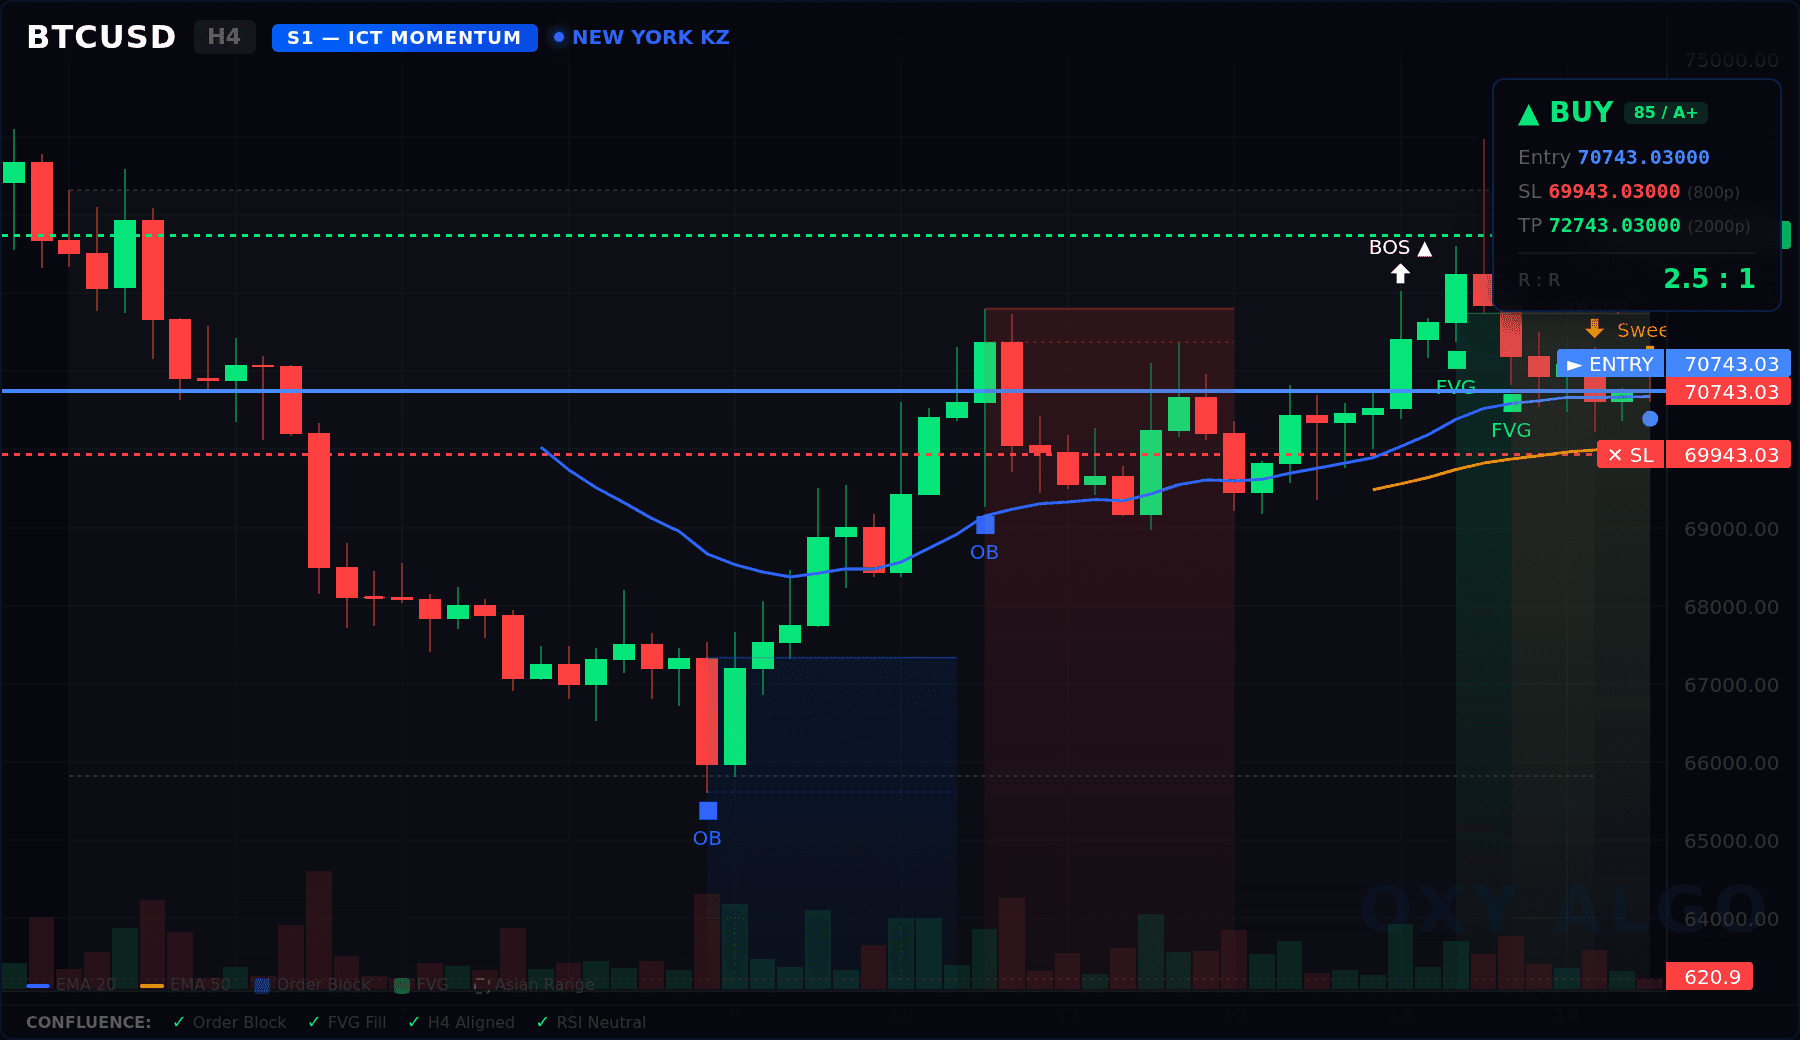
Bitcoin with Asian Range box, swing structure, and confluence bar.
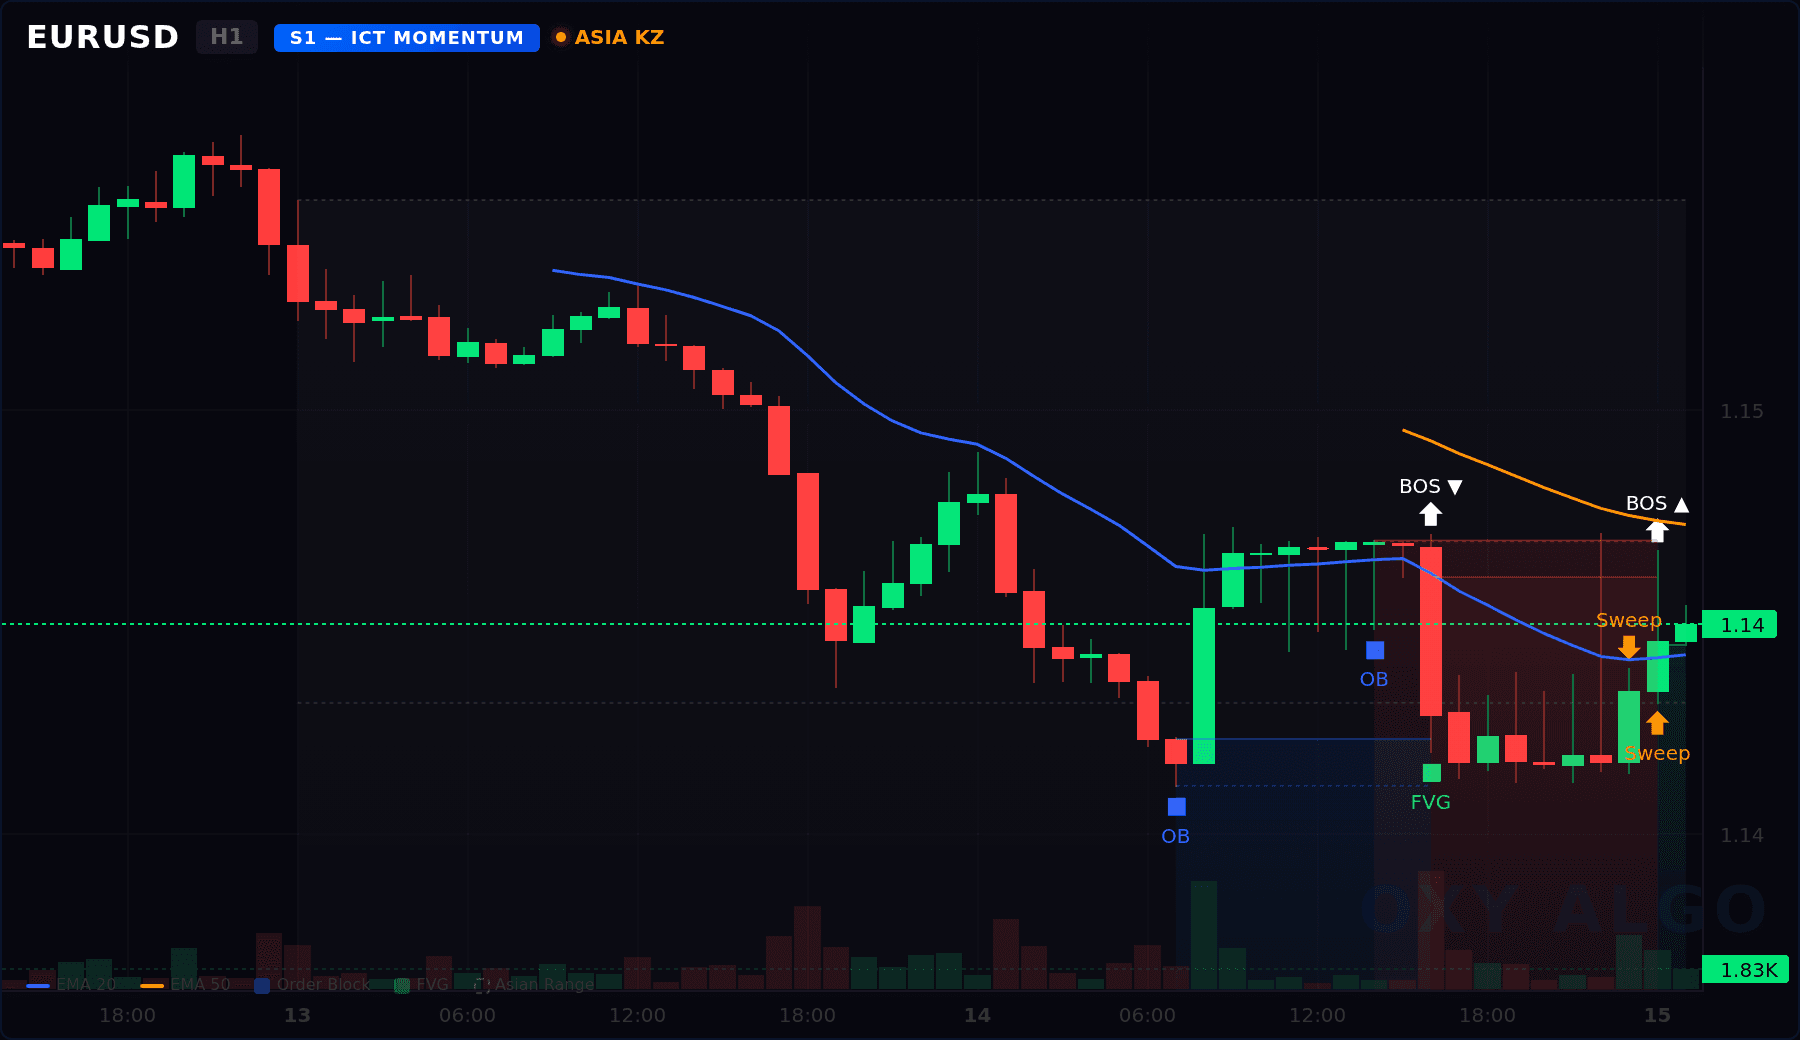
Pure price action with Orderflow patterns — no signal overlay. Pattern detection only.
What Makes Our Charts Different
Order Block Detection
Automatically identifies the last opposing candle before displacement moves. Bullish and bearish OBs drawn with transparent zones.
Fair Value Gap Detection
Finds imbalances between candle wicks — gaps the market wants to fill. Color-coded by direction.
Liquidity Sweep Markers
Detects when price takes out a swing level then reverses — the classic Orderflow stop hunt pattern.
Break of Structure
Marks the exact candle where price closes beyond a recent swing high or low — confirming trend shifts.
Asian Range Box
Draws the 00-06 UTC session range. London and NY sessions often sweep this range before reversing.
Trade Signal Overlay
Entry, SL, and TP levels drawn directly on chart with R:R ratio, confidence score, and confluence bar.
3-Layer Data Redundancy
Your charts never go dark. Three independent data sources ensure 99.9% uptime.
Layer 1 — Self-Hosted MT5 API
Our own MetaTrader 5 terminal running on dedicated hardware. Real-time candle data with no rate limits, no recurring fees, complete data ownership.
Layer 2 — In-Memory Cache
Hot cache refreshed every 2 minutes. Sub-millisecond response for repeat queries. 38 instruments across all timeframes.
Layer 3 — Cloud Failover
If both primary sources fail, Twelve Data cloud API serves candle data as emergency backup. Triple redundancy means zero downtime.
Try It Yourself
Generate a live Orderflow smart chart for any instrument. Real market data, real pattern detection.
Select an instrument and timeframe, then click Load Chart